Analyzing the shift from the Internal Combustion Engine to the Electric Powertrain Bundle through the lens of S-Curve Time Compression, Christensen’s Innovation Framework, and Total Cost of Ownership.
1. The Disruptive Innovation Framework
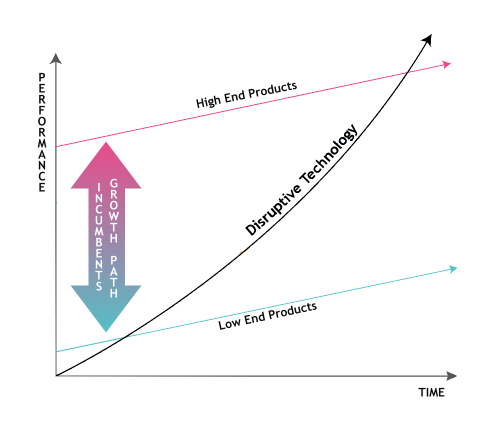
According to Clayton Christensen’s theory, disruptive innovations take root in simple, niche applications at the “bottom” of a market before relentlessly moving upmarket to displace established competitors.
 The Incumbent (ICE)
Historically, ICE manufacturers focused on “sustaining innovations”—incremental improvements to satisfy their most demanding customers, leaving the bottom of the market exposed to new entrants.
 The Disruptor (Electric Drive)

Electric marine motors initially entered as low-power trolling motors and in protected lakes. As battery tech improved, they rapidly moved upmarket and are now substituting 70-80hp combustion outboards on planing hulls.
2. ICE Engine vs. Electric MOTOR OUTBOARDS
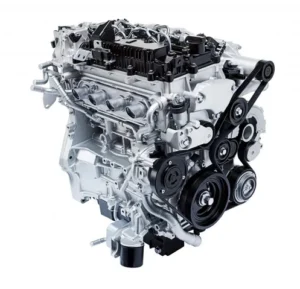
Internal Combustion Engine
ENGINE + LIQUID FUEL TANK
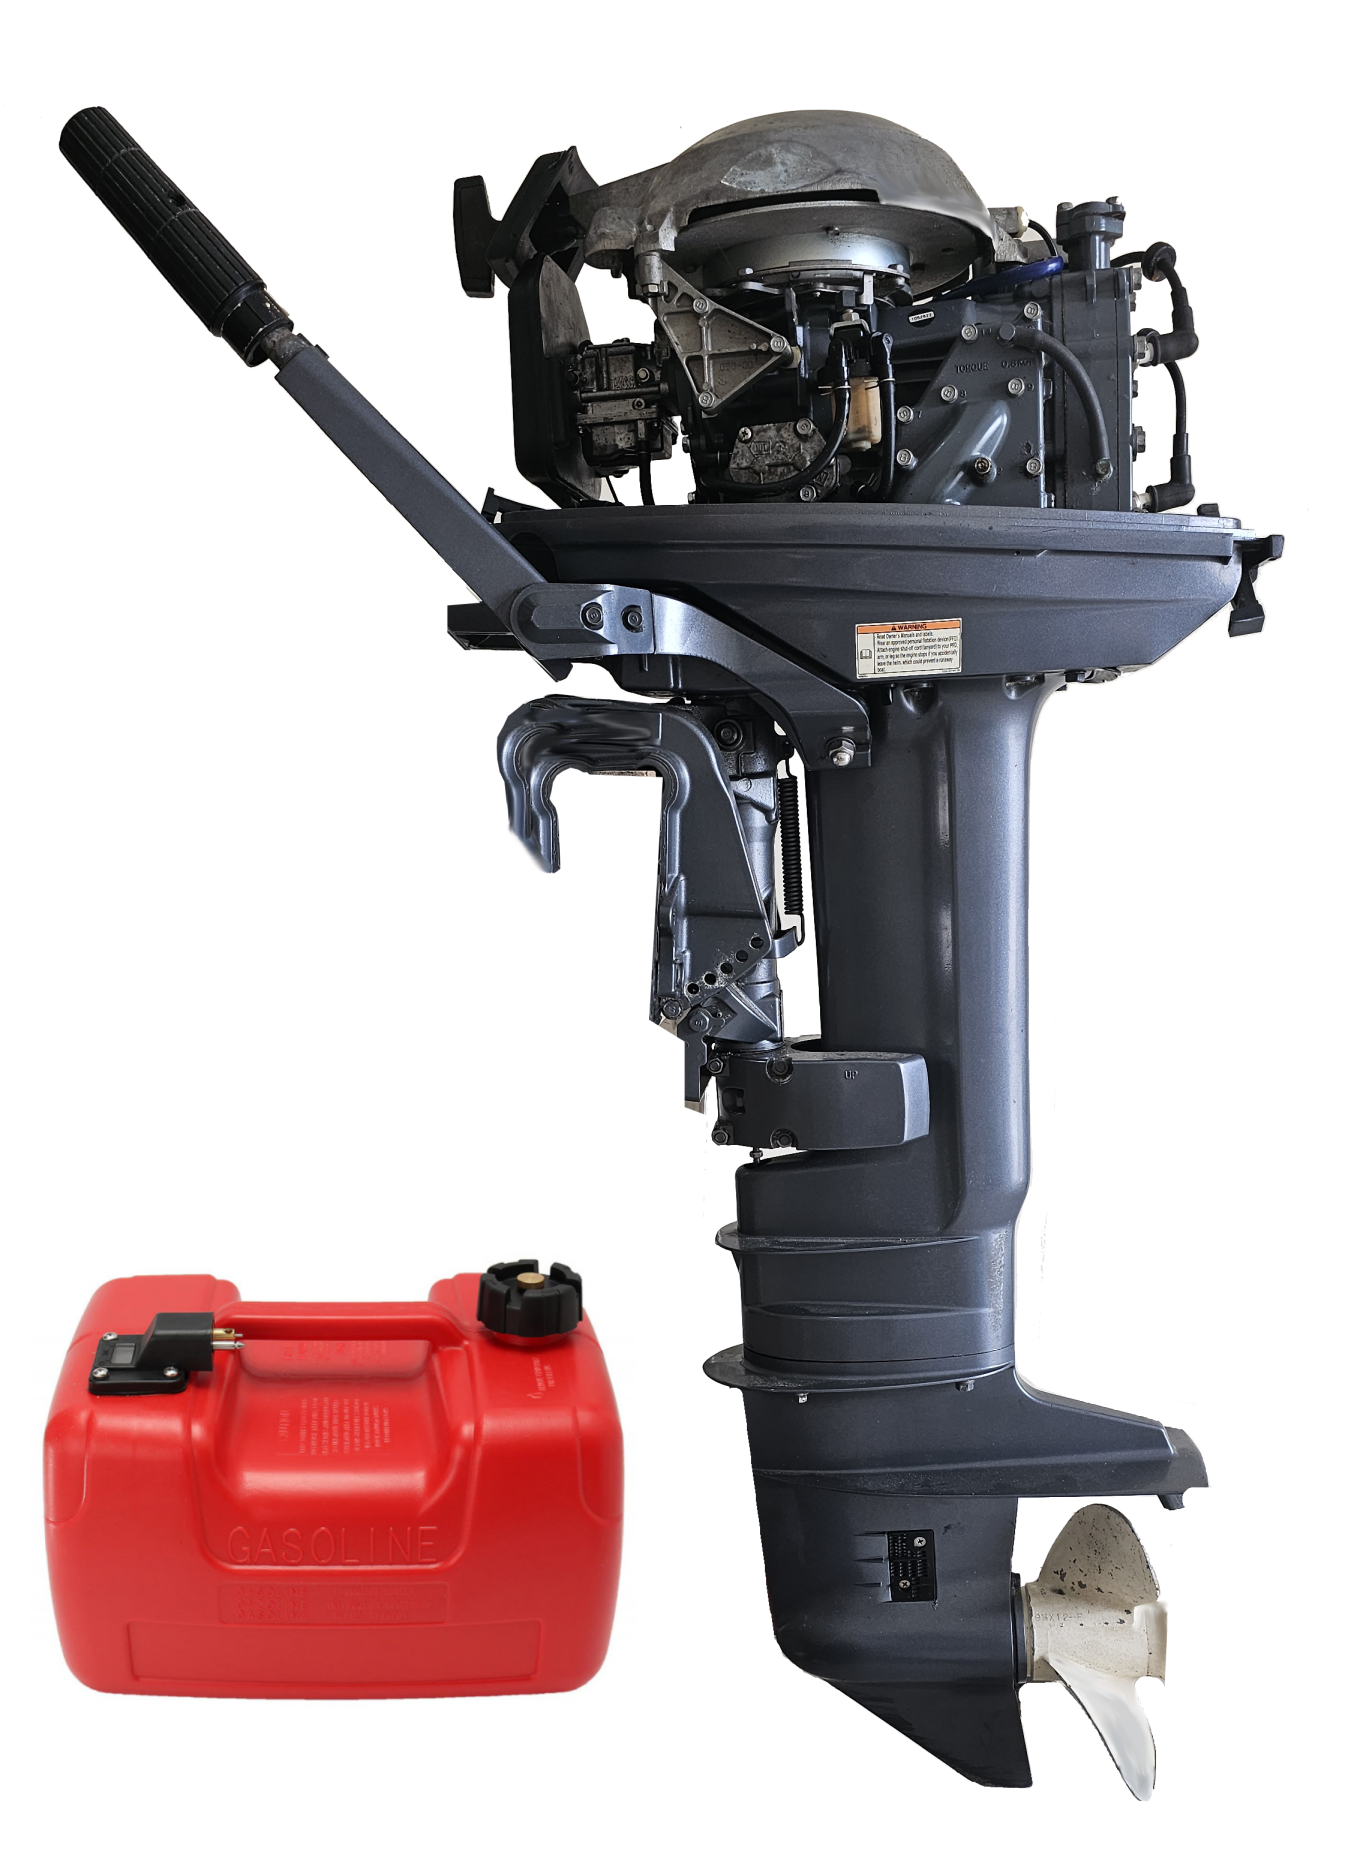
- ⚙️ Complexity: Highly complex, containing 200 to over 2,000 moving parts.
- 📉 Marine Efficiency: Wastes vast amounts of energy as heat. Only 5% to 15% of supplied energy is converted into actual propulsive power.
- ⏱️ Torque: Requires building up to high RPMs to reach peak torque, resulting in delayed power delivery and stall risks under heavy loads.
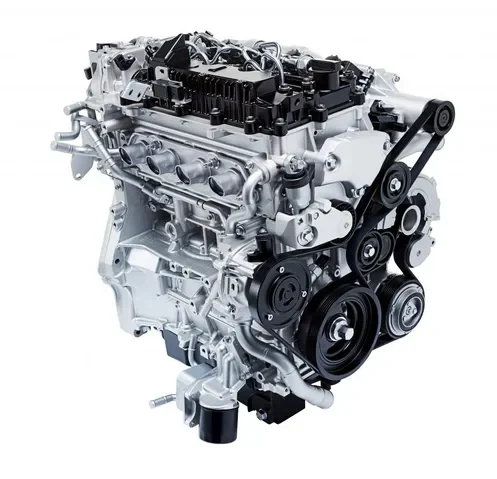
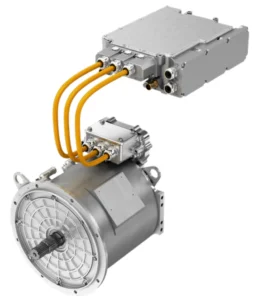
The Electric Drive
ELECTRIC MOTOR + LI-ION BATTERY
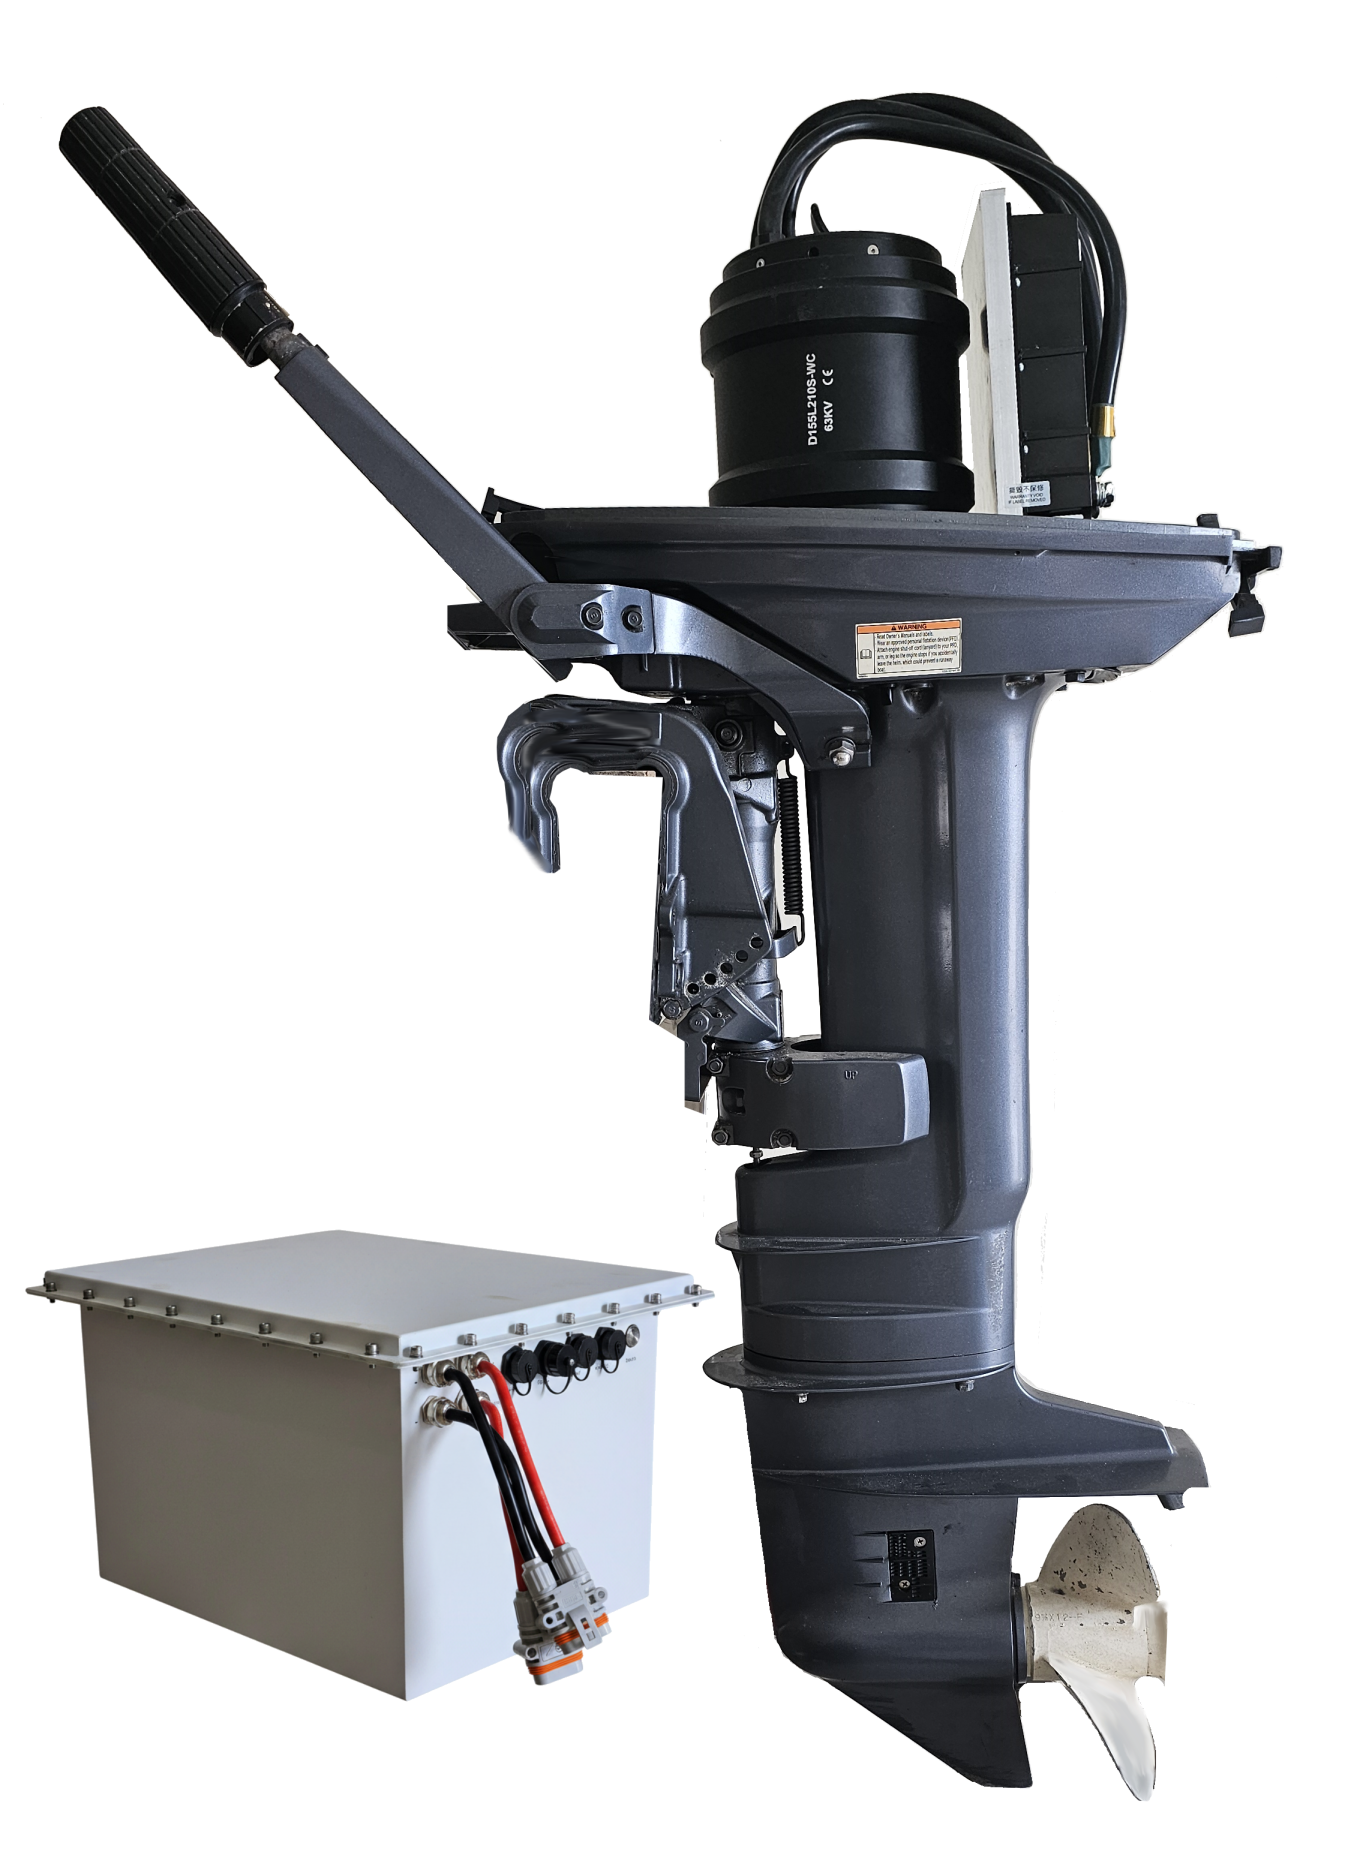
- ⚙️ Complexity: Radically simple drivetrain with only about 20 to 25 moving parts.
- 📈 Marine Efficiency: Highly efficient conversion; between 44% and 56% of available battery energy translates directly to propulsive power.
- ⏱️ Torque: Delivers 100% of maximum torque instantly at 0 RPM, allowing it to easily spin large, highly efficient propellers.
3. S-Curve Compression & Wright’s Law
The Exponential S-Curve
ICE vehicles required nearly 50 years to transition from early inception to mass-market dominance. In contrast, the EV transition is highly compressed due to cross-sector supply chains.
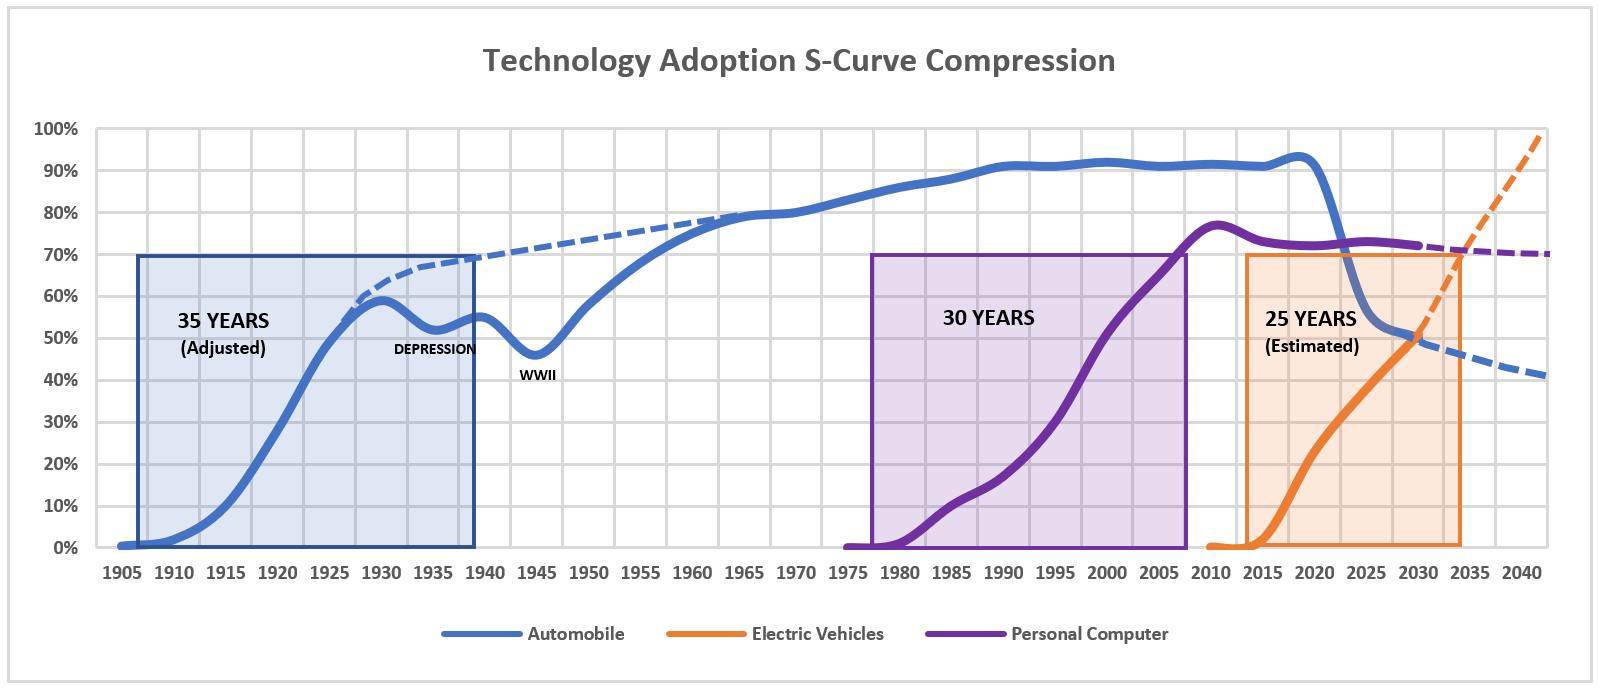
The 12-Year EV Sprint:
Data models indicate that leading markets take roughly 6 years to jump from a 1% to a 10% market share. Following this tipping point, it takes merely another 6 years to surge to an 80% market share.
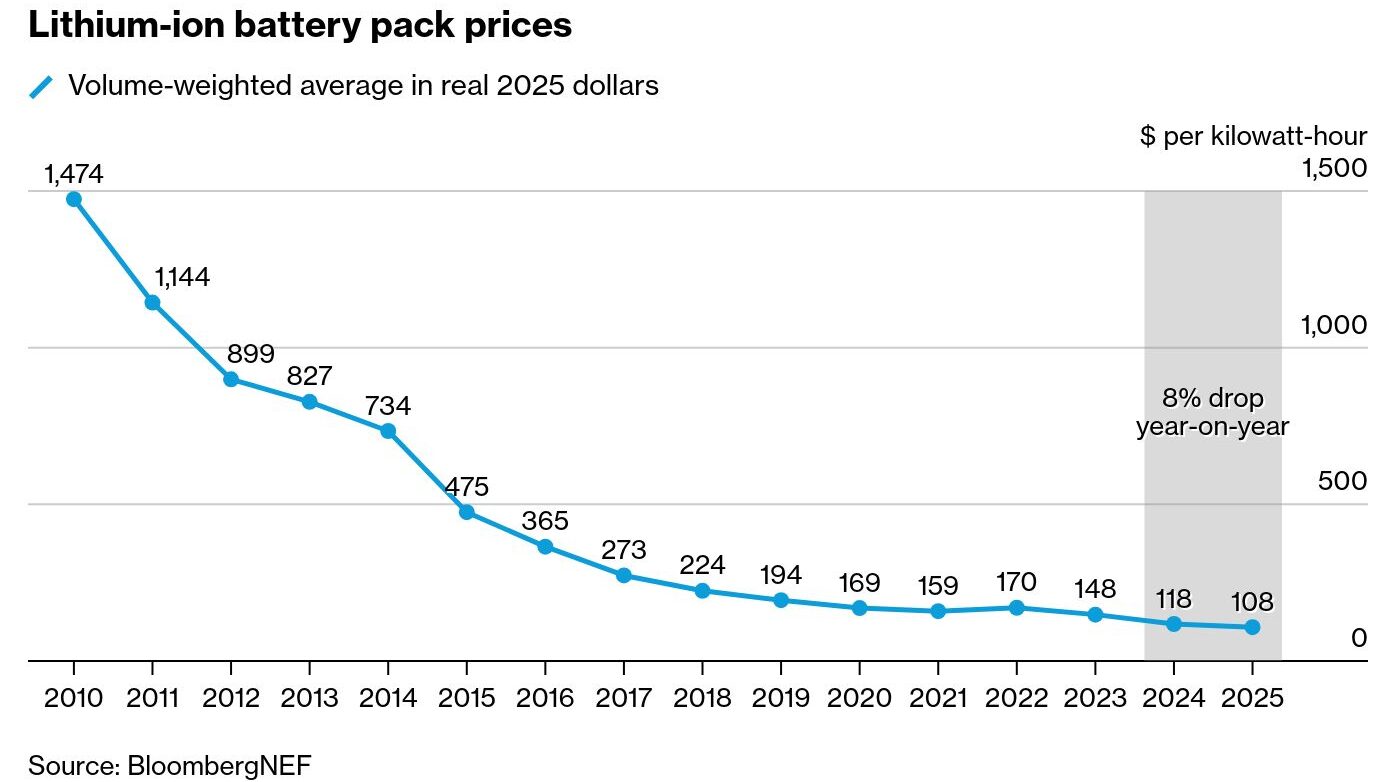
Wright’s Law (Cost vs. Scale)
Unlike the mechanical scaling of ICEs, battery manufacturing strictly follows Wright’s Law, where every doubling of cumulative global production yields a predictable cost decline.
4. Total Cost of Ownership (TCO)
While electric marine bundles have a higher initial Capital Expenditure (CAPEX) due to battery costs, their Operational Expenditure (OPEX) is drastically lower, altering the long-term economics of marine mobility.
Diesel/Gasoline Operating Costs
- ❌ High recurring fuel expenses.
- ❌ Frequent mechanical maintenance (oil, filters, spark plugs, winterization).
- ❌ 554 kg of CO2 emitted per 40nm trip.
Electric Drive Operating Costs
- ✅ Fraction of the cost to “refuel” via grid.
- ✅ Zero routine mechanical maintenance.
- ✅ Only 6.3 kg of CO2 emitted per 40nm trip.
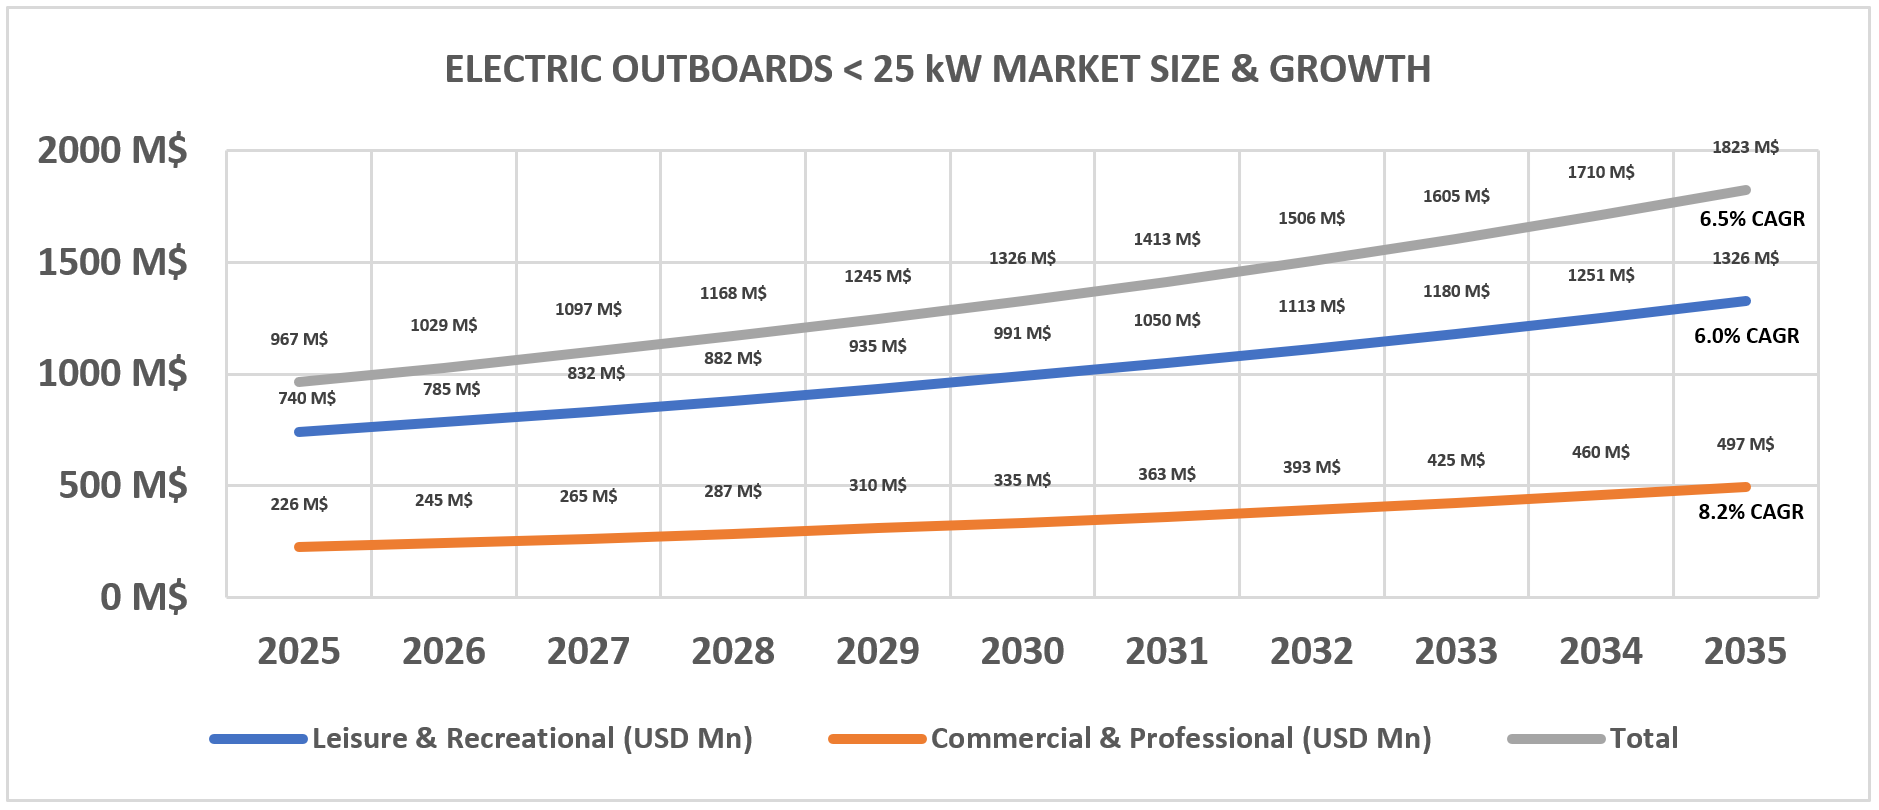
5. Market Size & Growth
The global market for marine electric outboards under 25 kW has officially and irreversibly transitioned from an experimental, boutique niche into a mainstream, highly capitalized commercial reality. Valued at over USD 811.6 million in 2024 and expanding at a robust compound annual growth rate of over 6%, toward a potential Two billion-dollar valuation by the next decade, this specific segment represents the absolute spearhead of maritime decarbonization.